Multi Indicators- MA, EMA, MA Cross, Parabolic SarMulti Indicators
- 3 Simple Moving Average
- 3 Exp Moving Average
- Cross of Moving Averages
- Parabolic SAR
Cari dalam skrip untuk "parabolic SAR"
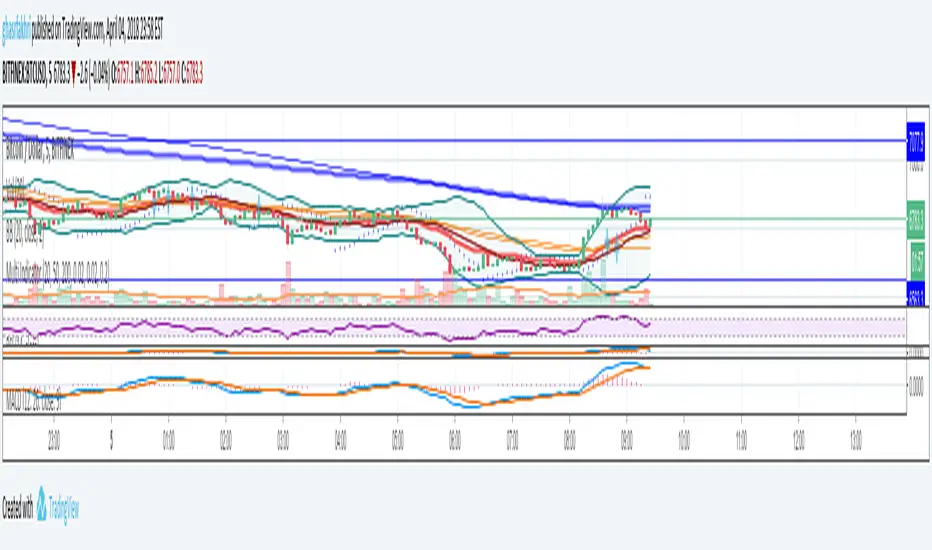
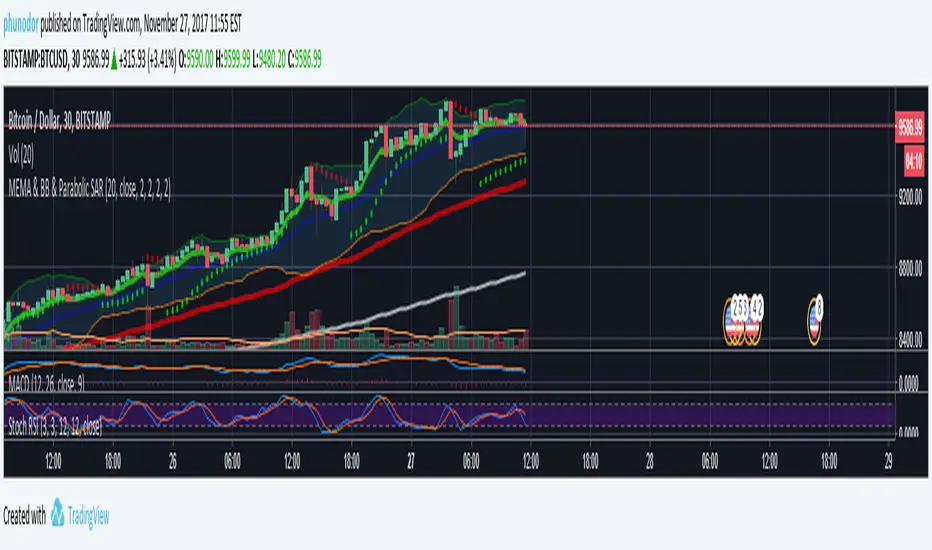
MEMA & BB & Parabolic SARMultiple Exponential Moving Average : 7, 77, 231
Bollinger Bands
Parabolic SAR
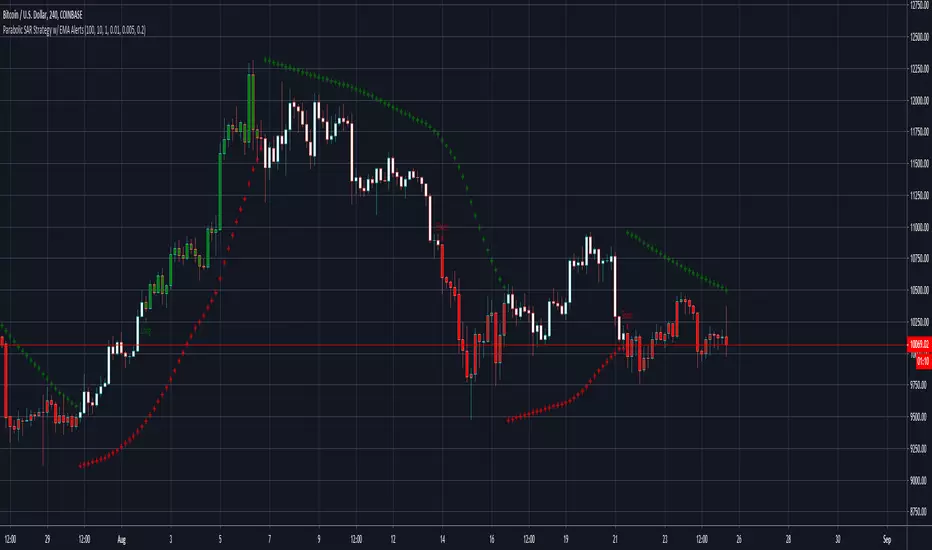
Parabolic SAR Strategy w/ EMALong when above EMA and SAR is in long state.
Short when below EMA and SAR is in short state.

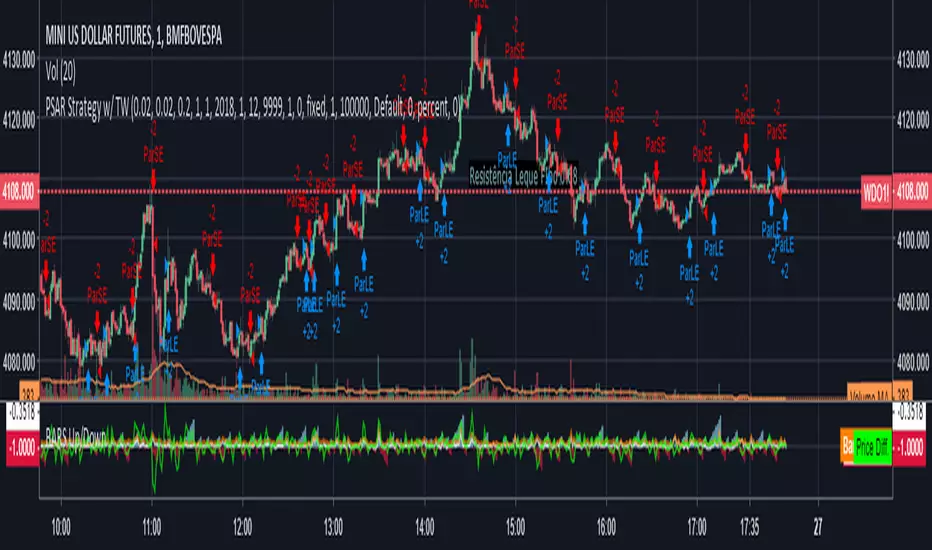
Parabolic SAR with the ADX overlayThe following indicator and chart pattern is based on a twist from Welles Wilder's parabolic stop and reverse . This is a trend following system which is essentially a dynamic trailing stop loss for longs and shorts. The system is often criticized for it's poor performance in choppy rangebound markets so people often combine it with other signals that attempt to identify a "trend" the ADX is a popular indicator with three indicators, the DI+ "Positive Directional Indicator" the DI- "Negative Directional Indicator" and then a combination of the two, the ADX "Average Directional Indicator". Generally speaking, if the DI+ is above the DI- and the ADX is greater than 25 then we are in a positive trending market. If the DI+ is less than the DI- and the ADX is greater than 25 then we are in a negative trending market. If the ADX is less than 25 then there is no trend in place and we are in a range bound "choppy market".
So, I created this chart to show when the ADX is > 25 (or you can enter your own number) and the DI+ is > DI- then the background will be green. Vice versa, when the ADX is >25 and the DI+ is < DI- then we are in a negative trending market and the background color will be red. If the ADX is < 25 (or whatever you choose) then we are in a choppy 'range-bound" market.
Regarding the ParSAR. Pay attention to the "+" marks. they indicate whether we are bullish or bearish. When we cross through a + then we revert to the opposite. "Stop And Reverse". They are a simple calculation of a starting percentage, an incremental increase in that percentage, and a max percentage increase. If you want your system to trade less, decrease the "maximum" If you want it to trade more, increase the maximum.
Tinker around with these and you might find a healthy strategy you can trade on.
If you add Take Profit Targets and Stop Loss Targets, this is an even more productive strategy. Try it out on BINANCE:ETHUSDT with a 2hr time horizon and 0.02, 0.023, 0.2.

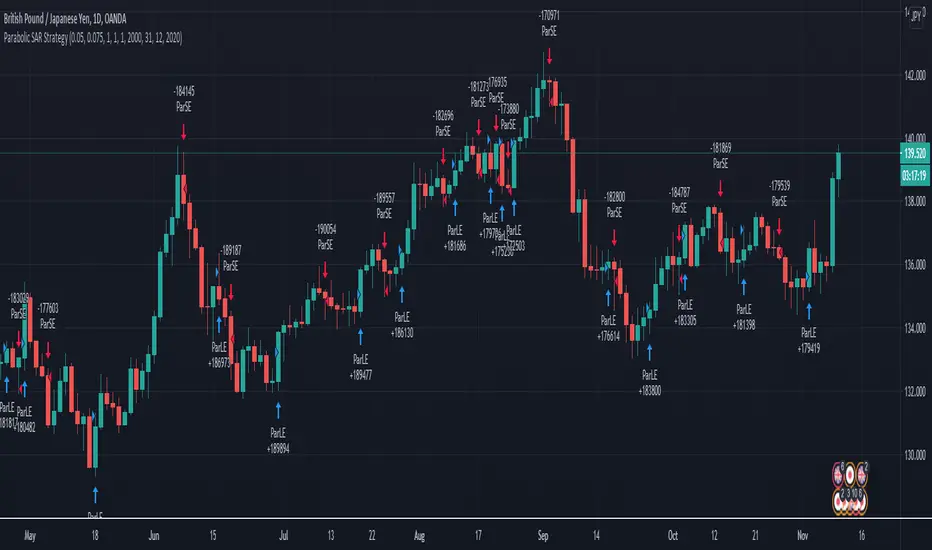
Parabolic SAR Swing strategy GBP JPY Daily timeframeToday I bring you a new strategy thats made of parabolic sar. It has optmized values for GBPJPY Daily timeframe chart.
It also has a time period selection, in order to see how it behave between selected years.
The strategy behind it is simple :
We have an uptrend , (the psar is below our candles) we go long. We exit when our candle crosses the psar value.
The same applies for downtrend(the psar is above our candles), where we go short. We exit when our candle cross the psar value.
Among the basic indicators, it looks like PSAR is one of the best canditates for swing trading.
If you have any questions, please let me know.
Power PSARParabolic SAR can reverse often in choppy environments. Power PSAR will indicate only when there's sufficient slope that cuts through the prior PSAR trend lines.


Parabolic SAR Strategy w/ EMA AlertsLong green arrow.
Short red arrow.
White bars = no trade zone.
Updating trailing stop daily.
Parabolic SAR StrategyReally questioning how the trailing stop works in the backtesting framework of tradingview/pinescript, I am sure I would not get the same results with the same strategy in MT4.

Parabolic SAR Strategy with good parametersI tested it on EURUSD with 2% profit:
Set input parameters like here: screenshots.firefox.com

Parabolic Stoch SAR VisualizerParabolic Stoch SAR Visualizer — Momentum-Driven Trend Precision Tool
Overview:
Parabolic Stoch SAR Visualizer is a thoughtfully engineered hybrid indicator that blends momentum oscillation and trend-following mechanics into one robust system. By applying a custom Parabolic SAR calculation directly on a double-smoothed stochastic oscillator (rather than on price), it generates cleaner signals with enhanced trend detection and fewer false positives than typical Parabolic RSI or standard SAR variants.
Unique Functionality:
Momentum smoothing : The base stochastic %K undergoes double smoothing via consecutive simple moving averages, significantly cutting down random noise and erratic swings common in raw stochastic readings. This stabilizes momentum tracking, isolating true price strength and weakness.
Custom Parabolic SAR on smoothed momentum : Traditional SAR algorithms operate on price data, acting as trailing stops. This indicator repurposes SAR to work on smoothed stochastic values, effectively converting it into a momentum-driven directional filter. This yields a more adaptive and responsive trend signal focused on genuine momentum shifts instead of price noise.
Bounded SAR range and adjustable acceleration : SAR values are mathematically restricted between 0 and 100, aligning with the stochastic scale to prevent distortions. Traders can customize acceleration parameters (start, increment, max) to fine-tune trend sensitivity relative to market volatility or specific strategies.
Signal clarity through filterin g: Minimum bar spacing and minimum SAR movement thresholds between plotted dots reduce chart clutter, highlighting only meaningful trend changes and filtering out insignificant fluctuations.
Enhanced visuals : The oscillator line smoothly transitions its color gradient between defined uptrend and downtrend hues, intuitively signaling momentum strength. Parabolic SAR dots are offset from the oscillator line with multi-layered glow effects, making trend flips easy to spot at a glance.
Trading Application:
Trend identification : Momentum-based SAR dots offer precise marking of trend shifts, helping traders avoid false breakouts and premature trades.
Entry and exit timing : Combining the double-smoothed stochastic oscillator and SAR dots creates a reliable framework to confirm momentum shifts and optimal trade entries or exits.
Customizable for volatility regimes : Adjustable acceleration and filtering parameters allow scalpers to increase signal sensitivity, while swing traders can dial back noise for smoother trend recognition.
Visual clarity for fast decisions : Gradient color coding and glowing SAR dots facilitate immediate momentum assessment without complex analysis, empowering quicker, more confident trade actions.
Advantages over Parabolic RSI and similar indicators:
Parabolic RSI’s direct application of SAR on RSI often results in noisy, choppy signals prone to whipsaws. This indicator’s double-smoothed stochastic foundation delivers a cleaner, steadier signal.
Applying SAR to smoothed momentum rather than price transforms it into a directional filter that better captures true market strength with reduced lag.
Adaptive plotting thresholds and enhanced visuals minimize clutter and ambiguity, improving trader focus and execution speed.

Parabolic RSI Strategy [ChartPrime × PineIndicators]This strategy combines the strengths of the Relative Strength Index (RSI) with a Parabolic SAR logic applied directly to RSI values.
Full credit to ChartPrime for the original concept and indicator, licensed under the MPL 2.0.
It provides clear momentum-based trade signals using an innovative method that tracks RSI trend reversals via a customized Parabolic SAR, enhancing traditional oscillator strategies with dynamic trend confirmation.
How It Works
The system overlays a Parabolic SAR on the RSI, detecting trend shifts in RSI itself rather than on price, offering early reversal insight with visual and algorithmic clarity.
Core Components
1. RSI-Based Trend Detection
Calculates RSI using a customizable length (default: 14).
Uses upper and lower thresholds (default: 70/30) for overbought/oversold zones.
2. Parabolic SAR Applied to RSI
A custom Parabolic SAR function tracks momentum within the RSI, not price.
This allows the system to capture RSI trend reversals more responsively.
Configurable SAR parameters: Start, Increment, and Maximum acceleration.
3. Signal Generation
Long Entry: Triggered when the SAR flips below the RSI line.
Short Entry: Triggered when the SAR flips above the RSI line.
Optional RSI filter ensures that:
Long entries only occur above a minimum RSI (e.g. 50).
Short entries only occur below a maximum RSI.
Built-in logic prevents new positions from being opened against trend without prior exit.
Trade Modes & Controls
Choose from:
Long Only
Short Only
Long & Short
Optional setting to reverse positions on opposite signal (instead of waiting for a flat close).
Visual Features
1. RSI Plotting with Thresholds
RSI is displayed in a dedicated pane with overbought/oversold fill zones.
Custom horizontal lines mark threshold boundaries.
2. Parabolic SAR Overlay on RSI
SAR dots color-coded for trend direction.
Visible only when enabled by user input.
3. Entry & Exit Markers
Diamonds: Mark entry points (above for shorts, below for longs).
Crosses: Mark exit points.
Strategy Strengths
Provides early momentum reversal entries without relying on price candles.
Combines oscillator and trend logic without repainting.
Works well in both trending and mean-reverting markets.
Easy to configure with fine-tuned filter options.
Recommended Use Cases
Intraday or swing traders who want to catch RSI-based reversals early.
Traders seeking smoother signals than price-based Parabolic SAR entries.
Users of RSI looking to reduce false positives via trend tracking.
Customization Options
RSI Length and Thresholds.
SAR Start, Increment, and Maximum values.
Trade Direction Mode (Long, Short, Both).
Optional RSI filter and reverse-on-signal settings.
SAR dot color customization.
Conclusion
The Parabolic RSI Strategy is an innovative, non-repainting momentum strategy that enhances RSI-based systems with trend-confirming logic using Parabolic SAR. By applying SAR logic to RSI values, this strategy offers early, visualized, and filtered entries and exits that adapt to market dynamics.
Credit to ChartPrime for the original methodology, published under MPL-2.0.

Lucid SARI wrote this script after having listened to Hyperwave with Sawcruhteez and Tyler Jenks of Lucid Investments Strategies LLC on July 3, 2019. They felt that the existing built-in Parabolic SAR indicator was not doing its calculations properly, and they hoped that someone might help them correct this. So I tried my hand at it, learning Pine Script as I went. I worked on it through the early morning hours and finished it by 4 am on July 4, 2019. I've added a few bits of code since, adding the rule regarding the SAR not advancing beyond the high (low) of the prior two candles during an uptrend (downtrend), but the core script is as it was.
This code is open source under the MIT license. If you have any improvements or corrections to suggest, please send me a pull request via the github repository github.com
For more details on the initial script, see
Sawcruhteez from Lucid Investment Strategies wrote the following description of the Parabolic SAR, where the quotes are from Section II of J. Welles Wilder, Jr.'s book New Concepts in Technical Trading Systems (1978)
--------------------------------------------------------------------------------------------------------------------------
Parabolic SAR
"The Parabolic Time / Price System derives its name from the fact that when charted, the
pattern formed by the stops resembles a parabola, or if you will, a French Curve. The system
allows room for the market to react for the first few days after a trade is initiated and then the
stop begins to move up more rapidly. The stop is not only a function of price but also a function
of time .
"The stop never backs up. It moves an incremental amount each day, only in the direction which
the trade has been initiated."
"The stop is also a function of price because the distance the stop moves up is relative to the
favorable distance the price has moved... specifically, the most favorable price reached since the
trade was initiated."
A. The calculation for a bullish Parabolic SAR is:
Tomorrow’s SAR = Today’s SAR + AF(EP - Today’s SAR)
"Acceleration Factor (AF) is one of a progression of numbers beginning at 0.02 and ending at
0.20. The AF is increased by 0.02 each period that a new high is made" (if long) or new low is
made (if short).
EP is the "Extreme Price Point for the trade made so far. If Long , EP is the extreme high price for
the trade; if Short , EP is the extreme low price for the trade.”
Most websites will provide the above calculation for the Parabolic SAR but almost all of them
leave out this crucial detail:
B. "Never move the SAR into the previous day’s range or today’s range
"1. If Long , never move the SAR for tomorrow above the previous day’s low or
today’s low . If the SAR is calculated to be above the previous day’s low or
today’s low, then use the lower low between today and the previous day as
the new SAR. Make the next days calculations based upon this SAR.
"2. If Short , never move the SAR for tomorrow below the previous day’s high or
today’s high . If the SAR is calculated to be below the previous days’ high or
today’s high, then use the higher high between today and the previous day
as the new SAR. Make the next days calculations based upon this SAR."
When a Bullish SAR is broken then it gets placed at the SIP (significant point) of the prior trend.
In otherwords it is placed above the current candle and at the price that was the SIP.
The inverse is true for the first Bullish SAR.
"This system is a true reversal system; that is, every stop point is also a reverse point." If breaking
through a bearish SAR (one above price) that simultaneously signals to close a short and go
long.

Options Series - P_SAR And Supertrend
The provided PineScript combines two well-known indicators—Parabolic SAR (P_SAR) and Supertrend—to create a comprehensive trading tool. Here are some powerful insights and the importance of this script:
⭐ 1. Supertrend Indicator:
What it does: The Supertrend indicator is based on the Average True Range (ATR) and is used to identify trend direction. When the price is above the Supertrend line, it suggests an uptrend, and when below, a downtrend.
Insights:
Trend Following: By adjusting the ATR length (atrPeriod) and the multiplier (factor), you can fine-tune the sensitivity of the Supertrend. A smaller ATR or factor results in more frequent trend changes, whereas larger values make the indicator more robust but slower to react.
Trend Visualization: The script highlights trends with the help of green and red lines, offering a clear visual cue for traders. The uptrend is filled with a translucent green and the downtrend with red, allowing quick identification of market momentum.
⭐ 2. Parabolic SAR (P_SAR):
What it does: The Parabolic SAR is a time/price-based indicator that helps identify potential reversals in the market. The dots (SAR) follow the price and move closer to it as the trend progresses.
Insights:
Trailing Stops: This is commonly used by traders to trail stop losses, as the SAR moves closer to price as the trend strengthens.
Combining with Supertrend: The SAR dots in this script act as an additional confirmation for trend direction. For instance, when the price is above both the SAR and Supertrend, it strongly suggests an uptrend.
⭐ 3. Bar Coloring Based on Trend Confirmation:
What it does: The script calculates conditions based on whether the price is above or below both the Supertrend and SAR values.
Insights:
Bullish/Bearish Confirmation: The combination of these two indicators provides a stronger confirmation of trend direction compared to using either one alone. For example:
Green Bars: If the price is above both the Supertrend and SAR, it signals a strong uptrend (bullish).
Red Bars: If the price is below both, it suggests a strong downtrend (bearish).
Visual Alerts: The candle colors are adjusted based on these conditions, providing a quick visual alert for traders to take action.
⭐ 4. Importance of Using Both Supertrend and P_SAR:
Multiple Confirmations: Combining the Supertrend and Parabolic SAR increases the accuracy of trend-following strategies. Each indicator has its strengths: Supertrend is good for identifying the overall trend, while the SAR excels at identifying potential reversals.
Risk Management: This script can help you not only identify trends but also manage your positions more effectively. The Parabolic SAR, for example, can serve as a dynamic stop-loss level, while the Supertrend can help you stay in trades longer by smoothing out noise in the market.
⭐ 5. Customizable Inputs:
Adaptability: The user can adjust the ATR period, factor, start, increment, and maximum values, tailoring the script to different market conditions and timeframes. This flexibility is essential, as each asset class or market may require different parameter settings.
⭐ 6. Practical Application in Trading:
Entry and Exit Signals: The script can be used to generate entry and exit signals. For instance:
Buy Signal: When the bar turns green (price is above Supertrend and SAR), it could be a signal to go long.
Sell Signal: When the bar turns red (price is below Supertrend and SAR), it could be a signal to go short or exit a long position.
Stop-Loss Placement: The Parabolic SAR dots can act as trailing stop-loss levels, helping traders lock in profits as trends progress.
Trend Continuation vs. Reversal: The Supertrend provides a broader view of the trend, while the Parabolic SAR provides pinpoint entry/exit signals for reversals.
🚀 Conclusion:
This script is a robust combination of trend-following and reversal indicators, making it a versatile tool for traders. The dual confirmation from Supertrend and Parabolic SAR reduces false signals, and the color-coded bars provide quick insights into market conditions. When used properly, this can greatly improve your ability to catch trends early, exit at the right moment, and manage risk effectively.

Parabolic RSI [ChartPrime]The Parabolic RSI indicator applies the Parabolic SAR directly to the Relative Strength Index (RSI) . This combination helps traders identify trend shifts and potential reversal points within the RSI framework. The indicator provides both regular and strong signals based on whether the Parabolic SAR crosses above or below key RSI thresholds.
⯁ KEY FEATURES
Parabolic SAR Applied to RSI – Tracks momentum shifts within the RSI indicator.
Dynamic SAR Dots – Plots SAR levels directly on the RSI for visual clarity.
Threshold-Based Signal Filtering – Uses upper (70) and lower (30) RSI levels to determine strong signals.
Simple and Strong Signal System :
Big Diamonds (Strong Signals) – Appear when Parabolic SAR crosses above 70 or below 30 RSI, indicating potential reversals.
Small Diamonds (Regular Signals) – Appear when Parabolic SAR flips inside the RSI range, signaling weaker trend shifts.
Chart Overlay Signals – Highlights strong RSI-based trend shifts directly on the price chart.
Fully Customizable – Modify RSI length, SAR parameters, colors, and signal displays.
⯁ HOW TO USE
Look for strong signals (big diamonds) when SAR flips above 70 RSI (overbought) or below 30 RSI (oversold) for potential reversals.
Use regular signals (small diamonds) for minor trend shifts within the RSI range.
Combine with price action and other indicators to confirm entry and exit points.
Adjust the SAR acceleration factors to fine-tune sensitivity based on market conditions.
⯁ CONCLUSION
The Parabolic RSI indicator merges trend-following and momentum-based analysis by applying the Parabolic SAR to RSI. This allows traders to detect trend shifts inside the RSI space with an intuitive diamond-based signal system . Whether used alone or as part of a broader trading strategy, this indicator provides a clear and structured approach to identifying momentum reversals and potential trading opportunities.

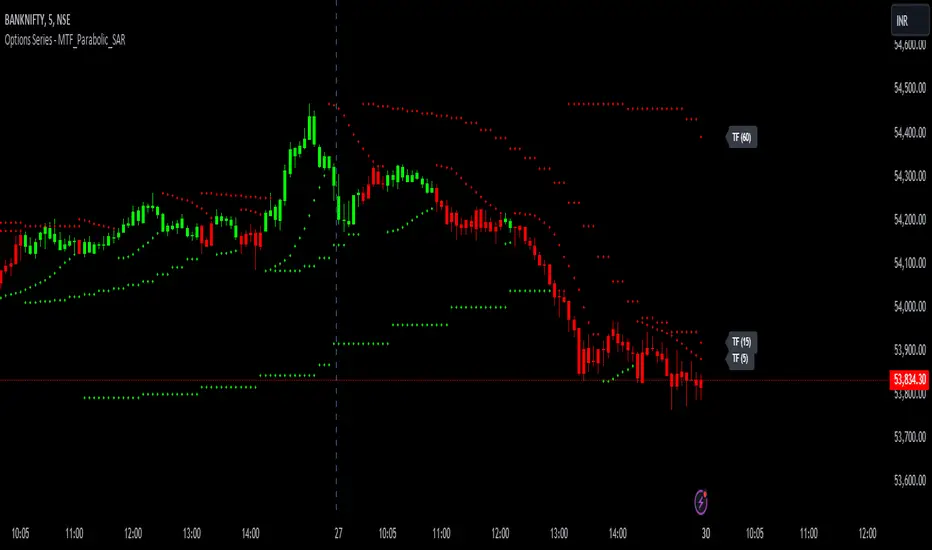
Options Series - MTF_Parabolic_SAR
⭐ Purpose of the Script
This script, titled "Options Series - MTF_Parabolic_SAR," is designed for analyzing price trends using the Parabolic SAR (Stop and Reverse) indicator across multiple timeframes (MTF). It dynamically highlights bullish and bearish conditions, helping traders identify trends with improved accuracy. The script uses the Parabolic SAR across three customizable timeframes (default: 5, 15, and 60 minutes) to gauge the market sentiment.
⭐ Key Features and Insights:
Multi-Timeframe Parabolic SAR: The script calculates the Parabolic SAR for three different timeframes ( input_tf_1 , input_tf_2 , and input_tf_3 ). Traders can configure these timeframes to match their trading style (e.g., intraday, swing).
The SAR plots adapt to the selected timeframe, helping traders see different perspectives of price movement, such as short-term and long-term trends.
Bullish and Bearish Conditions: The script determines bullish and bearish conditions by comparing the close price against the Parabolic SAR in each timeframe.
If at least one timeframe indicates a bullish condition (close price above SAR), the bars are colored green . Conversely, if one timeframe signals bearish conditions (close below SAR), the bars turn red .
This provides an at-a-glance view of the price trend across multiple timeframes, offering insights into the market's strength and direction.
Visual Enhancements: Bar Coloring: Bars are visually enhanced with a color scheme: green for bullish , red for bearish , and gray for neutral conditions. This makes it easy to spot market trends and reversals directly on the chart. Candle Plotting: The current candle is plotted with the corresponding color and labeled with the SAR values for each timeframe. This aids traders in tracking real-time price action.
Labeling of SAR Values: The script displays SAR values for each timeframe as floating labels next to the chart. These labels contain the timeframe and the exact SAR value, making it easier to reference without cluttering the chart.
⭐ Trading Advantages: Customizable and Adaptive: The customizable timeframes and SAR settings allow traders to adapt the script to various market conditions and their specific trading strategies. This flexibility provides a powerful tool for identifying entry and exit points. Multi-Timeframe Insights: By considering multiple timeframes, the script offers a comprehensive market view, making it easier to confirm strong trends and avoid false signals.
⭐ How It Helps Traders: Trend Identification: By visualizing Parabolic SAR across multiple timeframes, traders can quickly assess trend strength and direction. Reversal Detection: The script's color changes (green to red or vice versa) signal potential trend reversals, offering critical information for managing trades and reducing risk.
🚀 Conclusion:
This script provides traders with a multi-timeframe analysis tool for identifying trends and potential reversals using the Parabolic SAR. By offering customizable timeframes, clear visual cues, and SAR value labeling, it simplifies decision-making and enhances market insights.
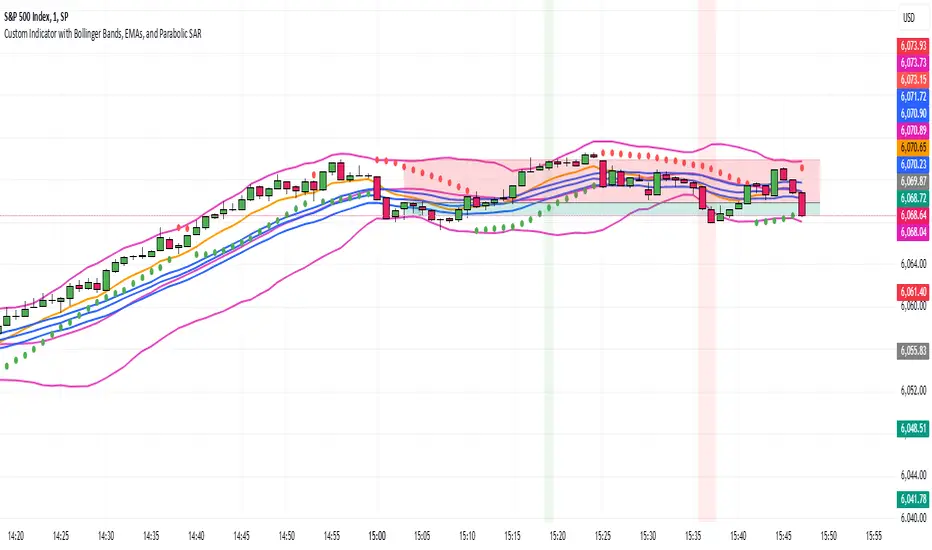
Jumbalika BandsThis indicator is designed using several common technical analysis tools: Bollinger Bands, Exponential Moving Averages (EMAs), and the Parabolic SAR. I'll walk you through each section to explain how it works and how you can use it:
1. Bollinger Bands
Bollinger Bands are used to measure volatility and overbought/oversold conditions. It consists of three lines:
Basis (Middle Line): A simple moving average (SMA) of the price over a defined period (in this case, 20 periods).
Upper Band: The basis plus a certain number of standard deviations. It represents the upper boundary of expected price movement.
Lower Band: The basis minus the same number of standard deviations. It represents the lower boundary of expected price movement.
Interpretation:
Overbought: If the price moves above the upper band, it could signal that the asset is overbought.
Oversold: If the price moves below the lower band, it could signal that the asset is oversold.
Volatility: A wider band indicates higher volatility, and a narrower band indicates lower volatility.
2. Exponential Moving Averages (EMAs)
The indicator plots four different EMAs:
9-period EMA: This is a short-term trend indicator.
20-period EMA on Close: This is another medium-term trend indicator, based on the close price.
20-period EMA on High: A variation of the 20-period EMA, but based on the high prices.
20-period EMA on Low: A variation of the 20-period EMA, but based on the low prices.
Interpretation:
9 EMA: A faster-moving average that responds quicker to price changes. It can be used to identify short-term trends.
20 EMA: A slower-moving average that reacts more gradually to price changes. It helps identify the broader trend.
High/Low EMAs: These give additional insights into the extremes of price action, which can help identify possible support or resistance levels.
Trading signals (common usage):
Crossover: When a shorter EMA (like the 9 EMA) crosses above a longer EMA (like the 20 EMA), it could be a bullish signal. When it crosses below, it could be a bearish signal.
3. Parabolic SAR
The Parabolic SAR is a trend-following indicator that is used to identify potential price reversals. The Parabolic SAR is plotted as a series of dots either above or below the price, depending on the trend:
Below the price: The trend is up (bullish).
Above the price: The trend is down (bearish)
4. Background Coloring (Optional)
The background will change color when the price crosses the Bollinger Bands:
Green background when the price is above the upper Bollinger Band.
Red background when the price is below the lower Bollinger Band.
Adjust the values for Bollinger Bands, EMAs, and Parabolic SAR directly in the indicator settings to suit your trading preferences.
Bollinger Bands: If the price is above the upper band, it might indicate an overbought condition, while if it's below the lower band, it might indicate an oversold condition.
EMAs: The 9 EMA is often used to track short-term trends, while the 20-period EMAs (on the close, high, and low) help analyze the broader market trend.
Parabolic SAR: The Parabolic SAR is often used to identify trend reversals. If the SAR is below the price, the trend is up, and if it's above the price, the trend is down.
Background Color: The background coloring helps visually highlight potential market conditions when the price breaks out of the Bollinger Bands.
Example Use Case:
Decide the trend based on the parabolic SAR, when the bar touches the upper or lower Bollinger take a short or long position based on the price action using EMAs.
MPI(only signal)I have removed the MACD and Parabolic SAR displays used in the calculations from my work, MPI, and changed them to show only buy/sell signals.
There is no difference from the previously posted MPI other than the appearance, including the alerts.
Please use whichever looks better.
In case you are interested, I will post the same description again as the MPI I posted last time.
- - - - - - - - -
This indicator is used to make trading decisions for ETFs and mutual funds ( TQQQ , QLD , SPXL , etc.) that are leveraged to stock indices.
It displays buy and sell signals and sends notifications when both MACD and Parabolic SAR give trend reversal signals.
Specifically, the following cases are considered as buy/sell signals.
Buy signal
-When Parabolic SAR shows a buy signal after MACD has made a golden cross
-When MACD shows a golden cross after Parabolic SAR shows a buy signal
Sell signal
-When Parabolic SAR shows a sell signal after MACD has made a dead cross
-When MACD shows a dead cross after Parabolic SAR shows a sell signal
Apply this indicator to the underlying index of the leveraged ETF ( NDX for TQQQ and QLD ) and trade the leveraged ETF using the buy or sell signal on the underlying index.
Note that the stocks to which you apply this indicator and make trading decisions are different from the stocks that you actually trade.
- - - - - - - - -
私の作品であるMPIから計算に使用しているMACDとパラボリックSARの表示を取り除き、売買シグナルのみ表示するように変更しました。
アラートを含め、見た目以外に前回投稿したMPIとの違いはありません。
どちらか見た目が好きな方を使ってください。
興味のある方向けに、前回投稿したMPIと同じ説明文を再度掲載します。
- - - - - - - - -
株価指数にレバレッジをかけたETFや投資信託( TQQQ , QLD , SPXL など)の売買判断をするためのインジケーターです。
MACDとパラボリックSARの両方でトレンド転換シグナルが出たところで売買シグナルを表示し、通知を送ります。
具体的には以下のような場合を売買シグナルとします。
買いシグナル
・MACDがゴールデンクロスした後、パラボリックSARが買いシグナルを示したとき
・パラボリックSARが買いシグナルを示した後、MACDがゴールデンクロスしたとき
売りシグナル
・MACDがデッドクロスした後、パラボリックSARが売りシグナルを示したとき
・パラボリックSARが売りシグナルを示した後、MACDがデッドクロスしたとき
このインジケーターをレバレッジETFの元指数( TQQQ , QLD ならば NDX )に適用し、元指数での売買シグナルでレバレッジETFを売買してください。
このインジケーターを適用し売買判断を行う銘柄と実際に売買する銘柄が違うことに注意してください。
- - - - - - - - -
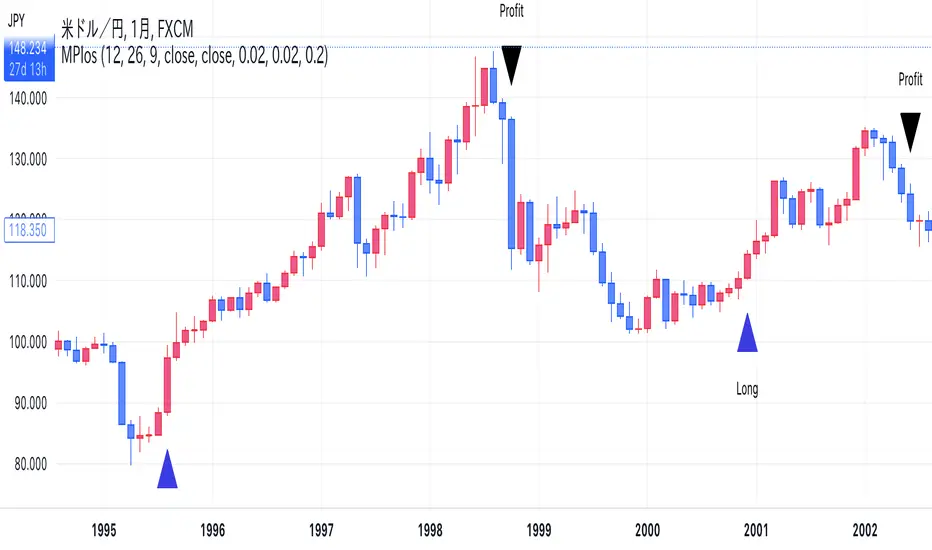
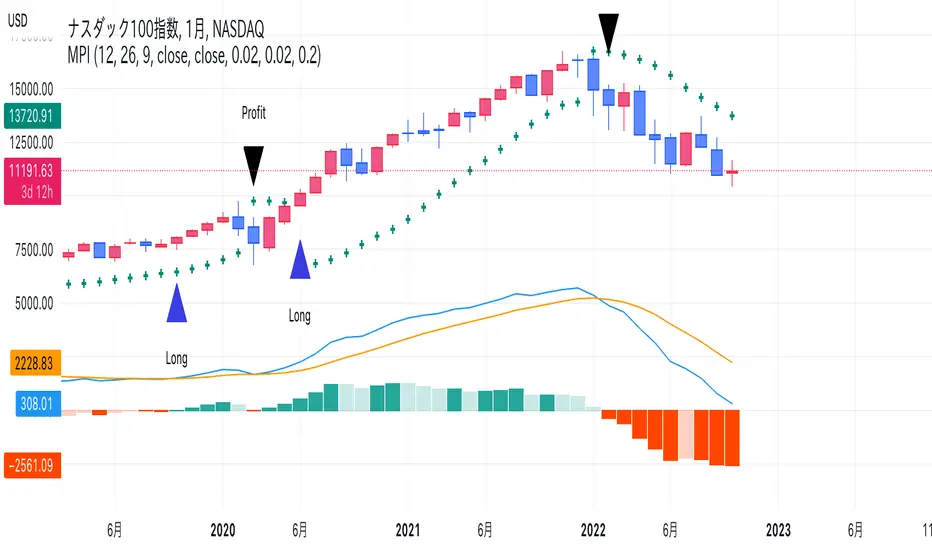
MPI(Monthly MACD & Parabolic Investment Indicator)This indicator is used to make trading decisions for ETFs and mutual funds (TQQQ, QLD, SPXL, etc.) that are leveraged to stock indices.
It displays buy and sell signals and sends notifications when both MACD and Parabolic SAR give trend reversal signals.
Specifically, the following cases are considered as buy/sell signals.
Buy signal
-When Parabolic SAR shows a buy signal after MACD has made a golden cross
-When MACD shows a golden cross after Parabolic SAR shows a buy signal
Sell signal
-When Parabolic SAR shows a sell signal after MACD has made a dead cross
-When MACD shows a dead cross after Parabolic SAR shows a sell signal
Apply this indicator to the underlying index of the leveraged ETF ( NDX for TQQQ and QLD ) and trade the leveraged ETF using the buy or sell signal on the underlying index.
Note that the stocks to which you apply this indicator and make trading decisions are different from the stocks that you actually trade.
株価指数にレバレッジをかけたETFや投資信託( TQQQ , QLD , SPXL など)の売買判断をするためのインジケーターです。
MACDとパラボリックSARの両方でトレンド転換シグナルが出たところで売買シグナルを表示し、通知を送ります。
具体的には以下のような場合を売買シグナルとします。
買いシグナル
・MACDがゴールデンクロスした後、パラボリックSARが買いシグナルを示したとき
・パラボリックSARが買いシグナルを示した後、MACDがゴールデンクロスしたとき
売りシグナル
・MACDがデッドクロスした後、パラボリックSARが売りシグナルを示したとき
・パラボリックSARが売りシグナルを示した後、MACDがデッドクロスしたとき
このインジケーターをレバレッジETFの元指数( TQQQ , QLD ならば NDX )に適用し、元指数での売買シグナルでレバレッジETFを売買してください。
このインジケーターを適用し売買判断を行う銘柄と実際に売買する銘柄が違うことに注意してください。
Measure Volume, Momentum, Trend, VolatilityThis script displays the following indicators in one pane to quickly determine several important factors regarding price action. It allows the user to quickly see all of most important factors surrounding price action in one pane with one quick glance. This should be incredibly helpful and allow things like double divergence and trend confirmation to be spotted much more quickly. I personally use the data in this indicator to replace four separate indicators and it has brought my win rate and profit factor significantly higher. I hadn't seen any place where all of the best J. Welles Wilder indicators such as RSI, Parabolic SAR, and DMI/ADX were brought into one easy to use interface. This is my attempt at fixing that gap. For a much deeper understanding of how to use these indicators, I recommend reading New Concepts in Technical Trading Systems written by J. Welles Wilder.
Momentum via RSI (Relative Strength Index)
Volume via MFI (Money Flow Index)
Volatility via DMI/ADX (Direction Movement Index/Average Directional Index)
Trend via Parabolic SAR (Parabolic Stop and Reverse)
It is worth noting that DMI/ADX and Parabolic SAR can both help determine trend strength and volatility.
The Volatility mechanism is measured by DMI and ADX and displayed at the top of the pane using circles. The top, tiny circles reflect if show if positive DI or negative DI has a higher value. The small circles directly underneath indicate whether or not the ADX is above 20 (configurable, some may choose to increase this to 25 or even 30).
The Momentum mechanism is shown as standard RSI with the default being a white line and default period of 14, which is all configurable.
The Volume mechanism is shown as standard MFI with the default being a fuchsia line and default period of 14, which is also configurable.
The momentum and volume oscillators should be used in conjunction to help spot whether the trend is strong or weak using divergences and the middle, overbought, and oversold levels. These levels are also configurable.
The Trend mechanism is measured by Parabolic SAR and displayed at the bottom of the pane using diamonds. The default is red diamonds when in a bear trend, green when in an uptrend which is configurable. When price is above the Parabolic SAR, it is considered to be an uptrend. When price is below the Parabolic SAR, it is considered to be a downtrend. The way price is measured is also configurable (i.e. open, close, ohlc4, hlc3, etc.). When price crossed above or below the Parabolic SAR, the diamonds will change colors.
All the indicators displayed should be used in a well rounded strategy. For instance, I only trade when ADX is above 20 and rarely trade against the trend shown via PSAR. When trend shifts and divergences helped indicate a trend shift would occur using the RSI and MFI, it can be a great spot to take an entry. RSI/MFI can also confirm the trend is strong when they are not showing divergences and inline with price action. All of this data should be used in conjunction with good fundamental data and technical levels. Divergences with RSI and MFI on double tops or bottoms can also be incredibly powerful. There is no right or wrong way to use all the data displayed in this indicator, however using all four pillars of trading (Momentum, Volume, Trend, Volatility) will help ensure only the best trades are taken.

Pullback SARPullback SAR - Parabolic SAR with Pullback Detection
Description: The "Pullback SAR" is an advanced indicator built on the classic Parabolic SAR but with additional functionality for detecting pullbacks. It helps identify moments when the price pulls back from the main trend, offering potential entry signals. Perfect for traders looking to enter the market after a correction.
Key Features:
SAR (Parabolic SAR): The Parabolic SAR indicator is used to determine potential trend reversal points. It marks levels where the price could reverse its direction.
Pullback Detection: The indicator catches periods when the price moves away from the main trend and then returns, which may suggest a re-entry opportunity.
Long and Short Signals: Once a pullback in the direction of the main trend is identified, the indicator generates signals that could be used to open positions.
Simple and Clear Construction: The indicator is based on the classic SAR, with added pullback detection logic to enhance the accuracy of the signals.
Parameters:
Start (SAR Step): Determines the initial step for the SAR calculation, which controls the rate of change in the indicator at the beginning.
Increment (SAR Increment): Defines the maximum step size for SAR, allowing traders to adjust the indicator’s sensitivity to market volatility.
Max Value (SAR Max): Sets the upper limit for the SAR value, controlling its volatility.
Usage:
Swing Trading: Ideal for swing strategies, aiming to capture larger price moves while maintaining a safe margin.
Scalping: Due to its precise pullback detection, it can also be used in scalping, especially when the price quickly returns to the main trend.
Risk Management: The combination of SAR and pullback detection allows traders to adjust their positions according to changing market conditions.
Special Notes:
Adjusting Parameters: Depending on the market and trading style, users can adjust the SAR parameters (Start, Increment, Max Value) to fit their needs.
Combination with Other Indicators: It's recommended to use the indicator alongside other technical analysis tools (e.g., EMA, RSI) to enhance the accuracy of the signals.
Link to the script: This open-source version of the indicator is available on TradingView, enabling full customization and adjustments to meet your personal trading strategy. Share your experiences and suggestions!

Options Series - Supertrend, HalfTrend, Ichimoku Cloud and P_SAR➤ Supertrend:
➤ HalfTrend:
➤ Ichimoku Cloud:
➤ Parabolic SAR:
⭐ Overview and How It Works:
This script combines multiple popular technical indicators—Supertrend, HalfTrend, Ichimoku Cloud, and Parabolic SAR—into a single, cohesive tool for analyzing price trends and reversals. Designed for traders who prefer multi-layered confirmation, it displays non-overlay signals in a candlestick format, helping users make sense of intricate market dynamics. It also includes a "Master Candle" condition, which aggregates the signals from all indicators, providing a powerful snapshot of market sentiment.
References for study,
Supertrend and HalfTrend and Ichimoku Cloud and Parabolic SAR
⭐ Key Features and Functionality:
The script integrates four indicators and visually represents them in a non-overlay fashion, meaning that each indicator's signal appears on separate candlestick layers. It uses color coding to differentiate between bullish and bearish signals. The Master Candle is a unique feature that aggregates the signals from all indicators to show the overall sentiment.
Supertrend: It uses ATR and a multiplier factor to create a trailing stop, identifying bullish and bearish trends.
HalfTrend: It analyzes market volatility that provides buy and sell signals based on volatility channels and historical highs and lows.
Ichimoku Cloud: It leverages historical highs and lows to form the conversion and baseline, which are compared to assess market strength.
Parabolic SAR: A stop-and-reverse system that highlights potential reversals. It is based on time and price, offering traders potential reversal points.
Master Candle: It computes a score based on the confluence of all four indicators, adding another layer of confirmation.
🎨 Visualizations and User Experience:
The script's user interface is highly visual, with color-coded candlesticks plotted across multiple layers. Each indicator has its own color coding for bullish and bearish signals, ensuring clarity:
➤ Green for bullish signals.
➤ Red for bearish signals.
➤ Each candlestick layer represents a different indicator (e.g., Supertrend, HalfTrend, etc.), making it easy for the trader to isolate and interpret signals.
➤ The "Master Candle" provides an overarching view of the market by displaying a consolidated signal, which can reduce confusion from mixed indicator signals.
⭐ Settings and Customization:
The script is highly customizable, allowing users to adjust the settings for each indicator. Key customizable parameters include:
• Supertrend ATR Period and Factor
• HalfTrend Amplitude and Channel Deviation
• Ichimoku Conversion, Base, and Lagging Span Periods
• Parabolic SAR Start, Increment, and Maximum value
Additionally, users can toggle the visibility of each indicator and customize the look of the plot to suit their preferences.
⭐ Uniqueness of the Concept:
No repaints. This is the advanced representation and the combination of multiple indicators into a single script, along with a powerful "Master Candle" that aggregates them, makes this tool unique. Most scripts provide isolated indicator signals, while this one brings together four powerful indicators and visually simplifies the analysis. The non-overlay style and color-coded candlesticks offer traders an easy-to-understand, actionable visual cue, which stands out from traditional indicator overlays.
🚀 Conclusion:
This script is a comprehensive, multi-indicator trading tool suitable for traders looking for reliable trend-following and reversal detection. Its ability to provide an aggregated "Master Candle" signal reduces noise and aids in better decision-making. Customization options allow users to tailor it to their trading style, while its clear visualizations provide an excellent user experience.
